
Item Link: Access the Resource
Date of Publication: September 16, 2014
Year of Publication: 2014
Publication City: Washington, DC
Publisher: Population Reference Bureau
Author(s):
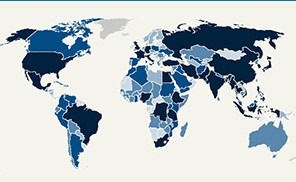
View data on global, regional, or country maps or tables using PRB’s 2014 interactive map. This map gives you 15 indicators organized in six tabs: population, births and deaths, life expectancy, family planning, income, and environment. For three of the indicators—infant mortality, total fertility rate, and life expectancy—we have included data from 1970 and 2013 to show trends over time. The environment indicator—carbon emissions—shows data from 1990 and 2012. Explore a portion of the map below and follow the link above to view the full interactive map from PRB
The views and opinions expressed through the MAHB Website are those of the contributing authors and do not necessarily reflect an official position of the MAHB. The MAHB aims to share a range of perspectives and welcomes the discussions that they prompt.