
Author(s): Gioietta Kuo
In our enthusiasm to quit using fossil fuels because of their Green House Gas (GHG) emissions, the world is plunging headlong into alternative energy sources: solar, wind, hydro and nuclear.
Yet each of these has its own problems. The most obvious ones are what happens if the sun does not shine, wind does not blow, rain does not fall, or we run out of nuclear fuel? Above all, we tend to avoid asking “How much will it cost?” Or, if we have no choice, then “Can we afford it?”
This article offers an overview comparing all of the alternative energy sources we are developing for our present and conceivable future needs.
INTRODUCTION
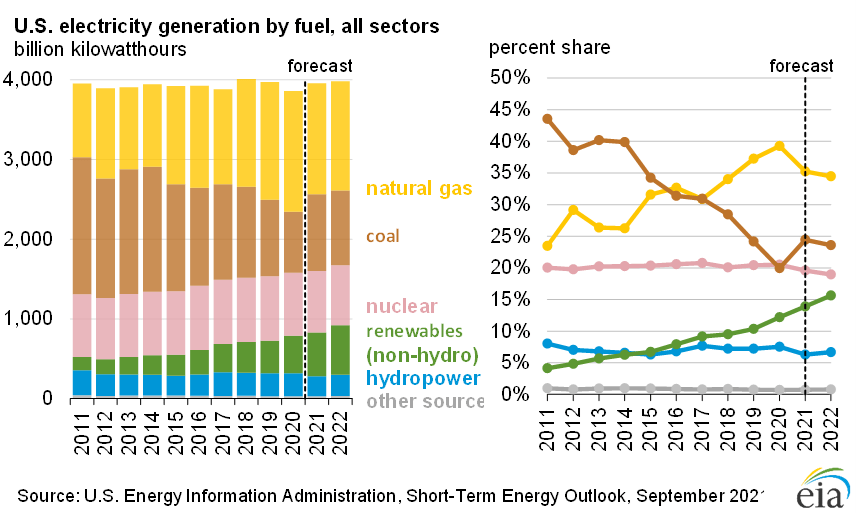
In 2020, total US electricity consumption was about
3.8 trillion kilowatt hours (kWh). [1] Electricity is
used in all sectors of economy. It is used for
lighting, heating, cooling and refrigeration and for
operating appliances, computers, electronics,
machinery and public transportation systems.
It is estimated that the U.S. electric power sector added 14.8 gigawatts (GW) of new wind capacity in 2020. We expect 16.0
GW of new wind capacity will come online in 2021 and 5.3
GW in 2022. Utility-scale solar capacity rose by an estimated
10.5 GW in 2020. Our forecast for added utility-scale solar
capacity is 15.5 GW 2021 and 16.6 GW for 2022 [2].
Figure 1. US Electricity generation by fuel [2]
The US uses a mix of energy sources and produces many
different types of energy. These can be grouped into
general categories such as primary and secondary,
renewable and nonrenewable, and fossil fuels.
Primary energy sources include fossil fuels (petroleum,
natural gas, and coal), nuclear energy, and renewable
sources of energy. Electricity is a secondary energy source
that is generated (produced) from primary energy sources.
Energy sources are measured in different physical units:
liquid fuels in barrels or gallons, natural gas in cubic feet,
coal in short tons, and electricity in kilowatts and kilowatt
hours. In the US, British thermal units (Btu), are commonly
used to compare different types of energy to each other. In
2020, total U.S. primary energy consumption was about
92,943,042, 000, 000, 000 Btu, or 93 quadrillion Btu.
- B. S. primary energy consumption by energy
source, 2020
In 2020, electricity produced by utility scale
generators in the US represented about 60% of all
the electricity generated or about 4,009 billion kWh.
In sum roughly 60% of this amount was produced
from fossil fuels (coal, natural gas and petroleum)
about 20% from nuclear energy and the remaining
20% from renewable energy sources.[2]
- U.S. Energy Use by Sector
There are 5 energy use sectors. In 2020 these were [1]:
electric power quads 35.74 %. Transportation quads
24.23%; industrial quads 22.1 %; residential quads
6.54%; commercial quads. 4.32%;
Total = 92.94 quadrillion Btu.
For renewable sources the total was 11.59
quadrillion Btu
Sales of electricity by percentage of the total generated to
major consumer sectors in 2020 [3] were as follows:
Residential 38.9%, or 1.46 trillion kWh; commercial
34.8%, or 1.28 trillion kWh; industrial 25.1% or 0.92
trillion kWh; and transportation 0.2%, or 0.01 trillion
kWh.
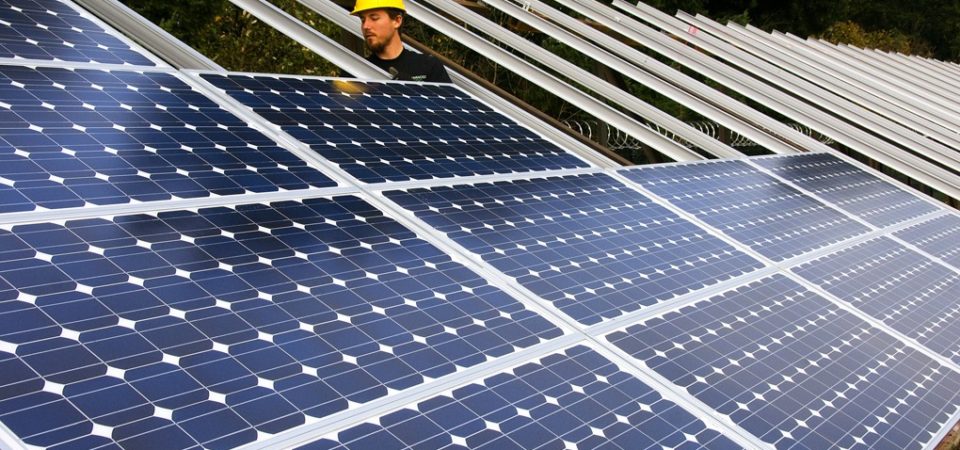
- SOLAR ENERGY
- A. It is possible to have large scale utility solar panels
for industrial uses or for feeding into the grid.
Also roof top residential solar panels on individual houses
are becoming popular to save high electricity costs.
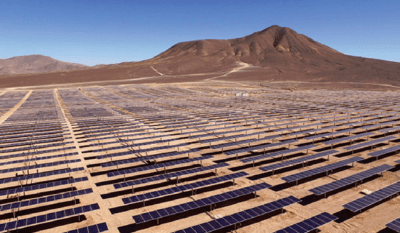
Figure 2 A typical utility solar panel installation
of 1-5 megawatts (MW). Spanning acres of land in
desert like locations.
The average house in the United States is between 2,000
and 2,499 square ft in size and uses 11,606 kWh of
electricity annually, or 967 kWh per month [4].
Of course electricity usage depends on the location of the
house. In the USA the Southwest gets the most sunlight,
and a house there that has a south facing roof without any
shading during the day, would require only between 16
and 25 premium solar panels to generate the roughly 1,000
kWh electricity per month. In this case, “premium” refers
to solar panels with an output rating of about 400 watts,
which are the highest efficiency panels currently available.
These include the SunPower A Series and LG NeON 2
series.
Budget solar panels can save one money, but will
generate less electricity per panel. The lowest efficiency
panels one can find on the market have a rating around
250 watts. That would mean an average house in the
Southwest would need 24-38 budget solar panels to
supply all of its electricity needs.
So what is the cost for society to go solar?
The best solar manufacturing cost analysis may be that of
the NREL – National Renewable Energy Laboratory [5],
which analyzes the manufacturing costs associated with
photovoltaic (PV) technologies, including crystalline silicon,
cadmium telluride, copper indium gallium diselenide,
perovkite, and III-V solar cells. All of these substances may
be evaporated on glass or some other material to make the
panel. Silicon is, by far, the most common semiconductor
material used in solar cells, and represents approximately
95% of the modules sold today.
The foregoing analyses are generally based on a bottom up
model with costs for the multiple components used along the
supply chain. In this way, we get a detailed look at the main
cost drivers.
- Estimated Cost of Solar Panels
Since 2010. NREL has been adding new information on new
technologies to provide PV cost reductions over time. This
includes new innovations, increased production volume and
other factors could drive future cost reductions.
Based on 2018 prices, here is a breakdown of the cost of
different components which contribute to the sales price of
solar panels in terms of US $.
We derive a Minimum Standard Price or (MSP).*
- Minimum Sustainable Price (MSP) is what
would need to be charged for a PV technology at any
given time to cover the production and overhead costs
and also to pay back investors.
*. Step by step and total manufacturing costs for a
given process to identify major cost drivers.
* Finally a roadmap is produced to identify
potential pathways for cost reduction in the near future.
We start at the bottom of the module, which is silicon. The standard monocrystalline silicon wafer size is around 244
cm2. For 2018 we provide here a breakdown of the different Components which contribute to the cost in terms of US $ per wafer.
In parentheses are given the cost of the item per wafer:
1) Silicon ($0.06);
2) Wafer processing ($0.1);
3) Remaining costs for module assembly ($ 0.02);
4) Remaining costs for cell fabrication ( $ 0.12);
5) Balance – of – module materials ($ 0.17);
6) Cell metallization pastes ($0.03);
7) Research & development plus sales, general administration ($0.07).
Total cost is $0.57 per wafer
Calculated sustainable price is $ 0.67.
As time goes on, we can expect reprocessing
advancements, efficiency gains, and economies of scale. So by
2025 the following numbers can be expected:
1) Silicon ($0.01);
2) Wafer processing ($0.04);
3) Remaining costs for cell fabrication ($0.02);
4) Balance – of – module materials ($0.06)
5) Research & development plus sales, general administration
($ 0.02).
Total cost projected for 2025 is $0.15.
Calculated sustainable price is $0.18.
Apart from the manufacturing cost we need to factor in
transportation of the delicate PV panels as well as the
installation cost of solar farms [6]. First there is the cost of
land: With all the equipment and space between panel rows, a
one MW solar farm typically needs 6–8 acres, Typical freight
charges for solar panels range from about $150 to $400 for
1- 24 solar panels.
Finally the solar farm installation costs are typically between
$0.82 to $1.36 per watt. That means that a one megawatt (MW)
solar farm would cost between $820,000 and $1,360,000.
Installation by experts may take 2-3 days and cost $800 – $1200.
It is interesting to note that so many new PV panels have
come on the market with high power ratings. Trina Solar
recently revealed a panel which will deliver an impressive
600W. Then in August, at the SNEC PV Power Expo in China,
JinkoSolar unveiled a 610W version of their current TigerPro
panel while Trina solar proposed a 660W+ panel is on the
horizon. Interestingly, there were close to 20 manufacturers at
SNEC 2020 showcasing panels rated over 600W.
- SOLAR BATTERIES
Of course, the sun does not shine all day long and so storage
batteries are also required. While the solar panel is lapping up
electricity, batteries are necessary for the time when the solar
panels are not accumulating power. Here is a collection of
specifications to consider:
* Capacity and Power Rating [7]
These are measured in kilowatt-hours (kWh).. While capacity
tells you how big your battery is, it doesn’t tell you how much
electricity a battery can provide at a given moment. For the
full picture, one also needs to consider the battery’s power
rating—that is, is the amount of electricity that a battery can
deliver at one time, measured in kilowatts (kW).
Depending on one’s needs, a battery with high capacity and
low power rating would deliver electricity for a long time,
while one with a high power rating would deliver more electricity but for a shorter time.
* Depth of Discharge – DoD [7]
This refers to the amount of a battery’s capacity that has been
used. Most manufacturers will specify a maximum DoD for optimal
performance. For a 10 kWh battery, one should not use more
than 9 kWh before recharging it, very much like a cell phone
or an electric car.
* Round trip efficiency [8]
Round-trip efficiency is the percentage of electricity put into
storage that is later retrieved. The higher the round- trip
efficiency, the less energy is lost in the storage process.
According to data from the U.S. Energy Information
Administration (EIA), in 2019, the U.S. utility- scale battery
fleet operated with an average monthly round-trip efficiency
of 82%, and pumped-storage facilities operated with an
average monthly round-trip efficiency of 79%.
This represents the amount of energy that can be used
as a percentage of the amount of energy that it took to
store it. For example, if you feed 5 kWh of electricity into
your battery and can only get 4 kWh of useful electricity
back, the battery has 80 percent round-trip efficiency
(4 kWh / 5 kWh = 80%). Generally speaking, a higher
round-trip efficiency means you will get more economic
value out of the battery.
* How long do solar batteries last? [7]
Most solar batteries on the market today will last
somewhere between 5 to 15 years. While that i s a significant amount of time, you will likely need to
replace them within the 25 to 30+ year lifespan of your solar system.
One might ask why this is such a varied range. There are
a couple of factors, including the type of battery you install,
how often you use the battery, and where the battery is
stored that will have a significant impact on how long the
battery lasts.
- TYPE OF BATTERY [9]
Batteries used in home energy storage typically are made with
one of three chemical compositions: lead acid, lithium ion,
and salt water. The total cost of solar battery installation tends
to fall in the $11,000 to $18,000+ range or $800 to $1,300 per
kWh. In most cases, lithium ion batteries are the best
option for a solar panel system, though other battery types can
be more affordable.
Bigger factories, the use of automation and more efficient
production methods, produce better with less materials waste
for the solar sector. The average cost for a solar panel
dropped by 90%. From 2010 to 2020. [10 ]
=. Lithium ion Batteries
This is the best for a solar combination. Currently 89% of
new energy storage capacity installed uses lithium ion
batteries [11]. Lithium ion batteries are lighter and more
compact than lead acid batteries. And they are rechargeable.
They also have a longer lifespan. In 2020 the price is $137/
kWh [5]. and is predicted to drop to around $100/kWh by
- However, lithium ion batteries are still more expensive
than their lead acid counterparts.
= Lead acid Batteries
This is a long tested technology that has been used in off grid
energy systems for decades. While they have a relatively short
life and lower DoD than other battery types, they are one of the
least expensive options currently on the market in the home
energy storage sector. For homeowners who want to go off the
grid and need to install lots of energy storage, lead acid can be
a good option.
= Saltwater Batteries
This new technology is easily dispensable, but not yet fully
tested. It offers medium cost and medium lifespan, but
maximum DoD. Unlike other home energy storage options,
saltwater batteries contain no heavy metals, relying instead
on saltwater electrolytes. While batteries that use heavy
metals, including lead acid and lithium ion batteries need to
be disposed of with special processes, a saltwater battery can
be easily recycled.
- A NOVEL TECHNOLOGY. COMBINING SOLAR CELL
AND DESALINATION [13]
As global overpopulation is rapidly increasing and we are
relentlessly using up our resources, fresh water scarcity has
become a severe global problem. According to a recent UN
report, already over 2. billion people live in countries
experiencing high water stress. Therefore researchers in Saudi
Arabia and China are developing a novel technology using a
combination of solar power generating electricity while at the
same time using its waste heat for desalination of seawater. It
is claimed that both these processes are highly efficient,
producing little waste brine and cutting its potential
environmental impact.
The process involves a highly complex multistage device
called a PV membrane distillation-evaporative crystallizer
(PME). PMEs consist of a solar panel on top of a multistage
membrane distillation (MSMD) component. The MSMD uses
waste heat from the solar cell to drive water evaporation, and is
designed to collect and reuse latent heat from vapor
condensation at each distillation stage to drive evaporation in
the next stage.
Clearly solar power is an attractive option for producing clean energy. But its limitations (expensive set-up, limited operational hours, the need for storage batteries and long transmission lines) mean that other sustainable energy sources are also needed.
- WIND ENERGY [10]
Wind turbines use blades to collect the wind’s kinetic energy as
it flows over the blades to run a generator. Wind blades are
mounted at about 100 meters above ground to catch the
stronger less turbulent wind. The turning shaft spins a
generator to make electricity. A stand-alone wind turbine is
typically used for water pumping or communications. Farms
and ranches may use it in windy areas.
Over the last 30 years, many advances in the use of wind
energy have grown over the world. As with solar energy, much
space is needed and many turbines are connected by heavy
duty cables leading the electricity to a distant grid.. High costs
are incurred not only for construction and maintenance of the
turbine itself but also for the cables which may cost 1 million $
per mile. Most commercial scale turbines installed today are
about 2 MW in size. U.S. total annual electricity generation
from wind has increased from about 6 billion kWh in 2000 to
about 300 billion kWh in 2019, accounting for about 7.3% of
total utility electricity generation.
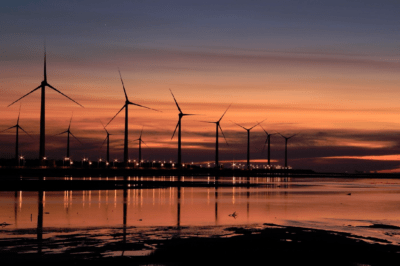
Figure 3. A large wind farm at sunset
So what does it cost society to go into wind energy?
- Cost of Home or Farm Scale Wind Turbines [14]
Wind turbines under 200 kilowatts cost roughly
$3,000 – $8,000 per kilowatt of capacity. A 10
kilowatt machine which is the size needed to power
a large home would have an installed cost of
$50,000 -$80,000. But it is more practical to
consider setting up a wind farm because there are
great economies of scale. On average a commercial
wind turbine may cost $2.6 – $4 million. Typically
the cost is $1.3 million/MW of electricity producing
capacity. Most turbines of this category have a
capacity of 2-3 MW so most turbines cost in the
$2-4 million range but the electricity generated can
be as high as 12 MW. Cost increases with size but
complexity and construction of the overall farm site
may benefit from having larger turbines. Each blade
has to be manufactured with high quality and
reliability.
- Installing a wind farm [15]
There are many constraints. These include highway underpass
heights that may limit the size of wind towers, the availability
of cranes able to lift and install nacelles, and the trucking
fleet’s difficulty in transporting longer wind blades. A study
released by the Energy Department, Enabling Wind Power
Nationwide, concluded that the technological innovations
enabling the development of very large wind turbines have
significant potential to reduce the cost of wind energy.
However, transportation and logistics challenges are limiting
the size and height of towers and turbines still remain.
- Underground vs overhead power line installation [16]
Because of unpredictable weather conditions, there are many
benefits to underground cable transmission, even though their
initial cost may be 4 to 14 items higher. These advantages
include shorter repair times for the same voltage and distance,
less danger of starting fires, etc..
A typical new 69 kV overhead single-circuit transmission line
costs approximately $285,000 per mile as opposed to $1.5
million per mile for a n ew 69 kV underground line (without
the terminals). A new 138 kV overhead line costs
approximately $390,000 per mile as opposed to $2 million
per mile for underground (without the terminals).
* Operation and maintenance costs [1]
Operation and maintenance costs may add $42,000 – $48,000
per year according to research on wind turbine operations.
Operation and maintenance costs constitute a sizeable
share of the total annual costs of a wind turbine.
For a new turbine, costs may easily make up 20-25 per cent
of the total cost per kWh produced over the lifetime
of the turbine. These costs may include: rent of land;
insurance; routine maintenance; repair; spare parts
and administration.
- Trucking and associated gas costs [18]
Depending on the distance between the finished product
leaving the factory to the location of the wind farm, it is
0difficult to estimate the final cost, but transportation and
construction are both sizeable components.
The nacelle that sits atop the tower or pedestal can weigh 75
tons, and the three-blade assembly can weigh 36 tons, or
about 12 tons per blade. The pedestal, or tower that supports
the nacelle, weighs on the order of 24 tons.
Current estimates indicate that it costs $100,000 to $150,000
to transport blades from either a port of entry or manufacturer
to a wind farm. As component parts of wind generators increase
in size, these costs can be expected to increase dramatically.
Wind-power too has much to recommend it as a source of sustainable energy. But again there are drawbacks such as high construction costs, difficulties transporting components to the wind-farm site, and unpredictable interruptions in service that demand significant energy storage capacity. So we would do well to consider further options.
III HYDRO ELECTRICITY ENERGY [19]
Energy from moving water is the most commonly used
renewable source of electricity. Hydro-energy, is a form
of renewable energy that uses the water stored in dams, as
well as flowing in rivers, to create electricity in
hydropower plants. The falling water rotates the blades of
a turbine, which then spins a generator that converts the
mechanical energy of the spinning turbine into electrical
energy.

Figure 4. A typical hydroelectric dam

Figure 5. The world’s second largest hydropower station –
Baihetan on the upper Yangtze River between the. provinces Yunnan and Sichuan in the People’s Republic of China has just started operation
China is the largest producer of hydroelectricity.
The Three Mile Gorge Dam which holds back the
Yangtze River is the largest hydroelectric dam in the world
and has enough generators to produce 22,500 megawatts
of power. Other top producers are located in the US, Brazil,
Canada, India and Russia.
Around 60 % of all renewable electricity is generated by
hydropower [19][20] which produces about 17 % of total
electricity production from all sources including nuclear and
fossil fuels, and 70 % of all renewable electricity . This is
expected to increase by 3.1% each year for the next 25 years
[20] [21]
Advantages to Hydroelectric Power [22][23]
- No fuel is burned so there is minimal pollution
- Water to run the power plant is provided free by nature
- Hydropower plays a major role in reducing greenhouse gas emissions
- Relatively low operations and maintenance costs
- The technology is reliable and proven over time
- It is infinitely renewable since rainfall replaces the water in the reservoir except in the event of drought when output may be much reduced.
Disadvantages [22][23]
- High investment costs for construction.
- Output depends on hydrology (rain and snowfall) habitats
- In some cases, loss or modification of fish habitats
- May halt or complicate fish migration patterns
- In some cases, changes water quality in rivers and reservoirs
- May require the displacement of local populations
Hydropower and the Environment [23]
Hydropower does not pollute the water or the air. However,
hydropower facilities can have significant environmental
impacts by affecting land use, homes, and natural habitats in
the area near and below the dam.
Most hydroelectric power plants have a dam and a reservoir.
These structures may obstruct fish migration and affect their
populations. Operating a hydroelectric power plant may also
change the water temperature and the river’s flow. These
changes may harm native plants and animals in the river and
on land. Reservoirs may cover people’s homes, important
natural areas, agricultural land, and archaeological sites. So, building dams can require relocating people. Methane, a strong
greenhouse gas, may also form in some reservoirs and be released into the atmosphere.
Taken together, Solar-, Wind-, and Hydro-power all provide
valuable means of generating electricity. Yet current and
foreseeable future demands for electric power are so great that still other options deserve careful consideration.
- NUCLEAR FISSION
Nuclear power is the only energy source that delivers reliable energy 24 hours a day.
At present nuclear energy provides 55% of carbon free electricity in the US [24].
A typical nuclear reactor uses Uranium-235. Natural uranium
contains only about 0.7% Uranium- 235, with the remainder
being an isotopic mixture consisting mostly of Uranium- 238
[25]. The fuel might cost $5,500/kW – $8,100/kW or between
$6 billion and 8 billion for a 1,100 MW plant. [26]. Even
though this cost is high, once built, operating costs are much
lower consisting solely of the fuel cost and the disposal of
fission products. This last however poses location and
political problems.
A fission reactor contains and controls a nuclear chain reaction
which produces heat through nuclear fission. This heat is used
to make steam that spins a turbine to create electricity. There
are 440 commercial reactors worldwide, including 94 in the
US.
- Types of light water reactors in US [27]
==. Pressurized water Reactor -PWR
More than 65% of commercial reactors are of this type,
which pumps water into the reactor under high pressure to
prevent the water from boiling. The water in the core is
heated by fission and then piped into tubes inside a heat
exchanger.
These tubes heat a separate water source to create steam
which then turns an electric generator to produce electricity.
== Boiling Water Reactor – BWR
It heats water and produce steam directly inside the reactor
vessel. Water is pumped up through the reactor core and
heated by fission. Pipes then feed the steam directly to a
turbine to produce electricity. The unused steam is then
condensed back to water and reused in the heating process.
In 2019 31 countries had commercial nuclear power plants of
which 14 supplied at least 20% of the nation’s total electric
output. The US has the greatest nuclear electricity generation
capacity.
- Top 5 nuclear electricity generating countries in 2019
[28] :
For US nuclear electricity generation capacity is currently 98
MkW; Actual electricity generation is 809 BkWh;
With 19% of total electricity used nation wide. For France, nuclear electricity generation capacity stands at 63 MkW; with actual electricity usage at 382 BkWh; of which nuclear accounts for 70%
For China , the figures are nuclear electricity generation
capacity is 46 MkW; actual electricity usage is 330 BkWh;
and nuclear’s share in the country is 5%
For Russia, nuclear electricity generation capacity stands at
28 MkW; and total electricity usage at 196 BkWh, of which
nuclear accounts for 14%.
For South Korea. Nuclear electricity generation capacity
is 23 MkW; total usage is 139 BkWh; and nuclear’s share
is roughly 25%
- BREEDER REACTORS [29]
A breeder reactor produces more fuel than it uses, and is
often touted as the answer to uranium-scarcity, which may
affect conventional reactors. However breeders are also
dangerous as they produce weapons–grade Plutonium and
thus pose a terrorist risk.
Nuclear reactors utilize the heat generated during fission of
atoms to produce energy. Breeder reactors contain an inner
core of the Plutonium isotope Plutonium-239 . This core is
surrounded by a shield of the uranium isotope Uranium 238.
When bombarded with neutrons, Plutonium splits to produce
smaller fragments, releasing heat energy, and more neutrons.
Some neutrons hit the surrounding Uranium-238 atoms which
is transmuted into Plutonium-239, effectively producing the
fuel itself. The remaining neutrons bombard other Plutonium
atoms, starting a chain reaction which produces more energy
and neutrons. When all the surrounding Uranium is converted
to Plutonium, the fuel is completely regenerated. A breeder
reactor is named so because it ‘breeds’ its own fuel.
There is a coolant surrounding the reactor which is used to
protect the core from overheating. It absorbs the heat generated
during the fission of Plutonium atoms and circulates it to a heat
exchanger. This heat converts water in the exchanger into
steam, which is used to drive a turbine and generate electricity.
Advantages [30]
- A breeder reactor creates 30% more fuel
than it consumes. After an initial introduction of
enriched uranium, the reactor only needs infrequent
addition of stable Uranium, which is then converted
into the fuel.
- It can generate much more energy than
traditional coal power plants. Just 3 grams of uranium, on
undergoing fission, can release ten times the energy
produced by a ton of coal.
- Breeder reactors can even use the Uranium
waste from other Uranium processing plants and spent
fuel from traditional fission reactors, along with depleted
Uranium from nuclear weapons as fuel.
- Uranium-235 used by light-water reactors is
rare on Earth, and its reserves are likely to run out
within 100 years. On the other side, Uranium-238 used
by breeder reactors is plentiful; in fact it is as common
as tin. In the US alone, uranium-238 reserves are
expected to last for at least 1,000 years.
- Fuel prices of breeder reactors will remain
fairly stable because of the abundance of Uranium-238
on Earth.
- This technology does not contribute to air
pollution, except during the mining and processing of
the Uranium ore.
- Breeder reactors use a small core, which is
important to sustain chain reactions. Besides, they do not
even need moderators to slow down neutrons, as they use
fast neutrons.
Disadvantages [30]
- Breeder reactors use highly enriched fuels,
which pose the danger of critical accidents. They also
work at a very high temperature and a fast pace.
- Plutonium persists for a long time in the
environment, with a half-life of 24,000 years, and is
highly toxic, causing lung cancer if even a small amount
is inhaled.
- Construction and operation are very costly.
Between $4 to $8 billion is required for construction
alone.
- The byproducts formed during the fission of
Plutonium have to be removed by reprocessing, as they
slow down the neutrons and reduce efficiency. However,
this step of reprocessing produces a very pure strain of
Plutonium, which is ideal for use in nuclear weapons.
This poses a risk, as terrorists may attempt to sabotage
or steal the Plutonium.
- To date, not a single breeder reactor has proven
economically feasible. Every year, billions of dollars
worldwide are spent for the safe storage of the Plutonium
produced, which is then useless, as few reactors use it as
fuel.
- In practice, a breeder reactor requires 30
years to produce as much plutonium as it utilizes in its
operation.
- It requires liquefied sodium or potassium
metal as a coolant, as water would slow down the
neutrons. These metals can cause a mishap, as they react
violently when exposed to water or air.
- These reactors are complex to operate.
Moreover, even minor malfunctions can cause prolonged
shutdowns. Their repair is tedious and expensive too.
- Breeder reactors have had several accidents. For
example, in the US, the Experimental Breeder Reactor I
suffered a meltdown in 1955. Similarly, Reactor Fermi I
suffered a partial meltdown in 1966, and was closed down
after a series of sodium explosions. Currently, only
Russia, China, India, and Japan have operational breeder
reactors.
So, while breeder reactors are highly efficient in producing
their own fuel, the costs and dangers they pose explain why
most nations choose to avoid them. This is why, US
President Jimmy Carter passed an executive order in 1977,
which banned the reprocessing of nuclear material.
- HIGH TEMPERATURE GAS COOLED REACTOR –
(HTGR) [31] However, there is a new generation, Generation IV, of nuclear
reactors which combine the benefits of safety with easier
disposal of radioactive materials. The High Temperature Gas
Cooled Reactor (HTGR)] uses a graphite moderator with a
once through Uranium fuel cycle. Its temperature can reach
1000º C. The reactor core can be either a “prismatic block” or
a “pebble-bed,” which is currently being developed in China.
This design takes advantage of the inherent safety
characteristics of a helium cooled graphite moderated core
with specific design optimizations. The graphite has large
thermal inertia and the helium coolant, which is inert, has no
reactivity effects. The graphite core is highly stabile even at
high temperatures.
The main features of HTGRs are enhanced safety, high
thermal efficiency, economic competitiveness, and
proliferation resistance and these make this technology a
promising candidate for nuclear power plant deployment [32].
One of the driving forces behind the HTGR philosophy is the
manner in which it produces heat. Net thermal efficiencies
greater than 45% can be achieved with some of the designs of
HTGRs. The high outlet gas temperatures may also be utilized
as a heat source in endothermic chemical processes. Examples
include applications in coal chemistry and upgrading of
hydrocarbons. Hydrogen production is another promising field
for deployment of the HTGR. The short construction period,
modularity and low capital cost are also attractive
characteristics of HTGRs. The foremost motivation for the
development of HTGR technology is its enhanced safety
features along with its high temperature capabilities.
The enhanced safety of HTGR fuel is due to its coated particle
design known as TRISO. [33] This is a Uranium,
carbon and oxygen mixture consisting of uranium oxide
coated with layers of pyrolytic carbon and silicon carbide.
Coated particles are so designed that they can withstand high
internal gas pressure without releasing any fission products to
the environment. They are also easy to collect for disposal.
The reactor uses helium as a coolant instead of water.
After the helium is heated to 750oC (1382oF)
It is sent into a stream generator where it heats water until
It becomes high temperature stream. That stream then flows
into a stream turbine. China’s SNPTC’s project consists
of two.MW high temperature reactor pebble-bed modules
There is also a joint venture with Saudi Arabia for a
seawater desalination project.
The future is on Very High Temperature Reactor – VHTR
operating at 1000oC
- Thorium Reactors [34]
Since uranium itself will not last more than a couple
of hundred years, a new thorium reactor is being developed,
mostly in India and China, using a more abundant thorium
found on earth – about 500 times greater than
Uranium-235.
Thorium has a higher melting point and lower operating
temperature which makes it inherently safer than straight
Uranium and more resistant to core meltdowns.
Thorium itself is fertile but not fissile. That means it is a
material, which is not itself fissile (fissionable by thermal
neutrons), that can be converted into a fissile material by
irradiation in a reactor. There are two basic fertile materials:
Uranium-238 and Thorium-232. When these fertile materials
capture neutrons, they are converted into fissile Plutonium-239
and Uranium-233, respectively.
Thorium reactor uses Thorium-232 combined with
Uranium-233 added to the fluoride salts in the core-The
molten salt turns into Liquid Fluoride Thorium Reactors.
LFTR. As fission occurs heat and neutrons are released from
the core and absorbed by the surrounding salt. This runs a heat
exchanger heating an inert gas such as helium which drives a
turbine to generate electricity. At the same time Thorium- 232
transmutes into Uranium-233 which is useful in a variety of
ways.
LFTR provides numerous benefits. Any leftover radioactive
waste cannot be used for weaponry. The fuel cost is lower than
that of a solid fuel reactor, it also is 20 % more efficient than a
traditional light-water reactor. Though still experimental,
LFTR may well prove to be the breakthrough solution that
will make nuclear energy an acceptable part of sustainable
green energy production everywhere on Earth.
- CONCLUSION
Alternative energies are certainly the energy of the future.
However, both solar and wind applications need a large
amount of space, and require high construction and
maintenance costs. Add to this the inevitable down time
when wind or sunlight are absent which makes it
essential to store energy in batteries of various kinds.
Only nuclear reactors can provide energy 24 hours a day with
very little down time or maintenance. In spite of high
construction and fuel costs, overall their operation is reliable
and low cost. However the use of radioactive fuels like
Uranium and Plutonium can lead to undesired dangers from
terrorism or the production of nuclear weaponry.
The question remains: Will the public accept the benefits
of nuclear energy while recognizing its related possible
ill effects? Or can new developments in science and
engineering reduce these dangers sufficiently to persuade
people around the world that nuclear power can generate
electricity safely?
————————————————————————
About the Author
Gioietta Kuo, MA at Cambridge, PhD in nuclear physics, Atlas
Fellow at St Hilda’s College, Oxford University and Princeton
University Plasma Physics lab, is a research physicist. She has
published over 70 professional articles and over 100 articles on
environmental problems in World Future Society publications and
online at wfs.org, amcips.org, MAHB (Millennium Alliance for
Humanity and Biosphere) Stanford and other worldwide think
tanks. Also in Chinese in ‘ People’s Daily’ and ‘World
Environment’ – Magazine of the Chinese Ministry of
Environmental Protection, and others in China. Her website is
www.gioiettakuo.com. She can be reached at
REFERENCES
[1] US energy facts explained – consumption and production EIA
https://www.eia.gov › energy explained › us-energyfacts
See Monthly Energy Review table 1,3 April 3032
[2]. Short-Term Energy Outlook – US Energy
Information … – EIA
https://www.eia.gov › steo › report › electricity
[3]. Electricity in the US – US Energy Information
Administration (EIA)
https://www.eia.gov › energy explained › electricity-in-t…
[4] How many solar panels are needed to run a 2,000 square foot …
https://www.thesolarnerd.com › blog › how-many-solar..
[5] SOLAR A standardize waffle Manufacturing CostA nalysis | Solar
Research | NREL
https://www.nrel.gov › solar › solar-manufacturing-cost
[6] What Is a Solar Farm? Costs, Land Needs & More
https://www.solarreviews.com › Blog
[7] The Best Batteries for Solar Power Storage https://
www.paradisesolarenergy.com › blog › the-best-ba… ..
[8] Utility-scale batteries and pumped storage return about 80 …
https://www.eia.gov › todayinenergy › detail
[9] What are the Different Types of Solar Batteries?
– SolarReviews https://www.solarreviews.com › Blo
[10] .Solar Technology Got Cheaper and Better in the 2010s. Now …
https://www.greentechmedia.com › articles › read › sola…
[11]. Solar-Plus-Storage 101 | Department of Energy
https://www.energy.gov ›
[12] Solar Device generates Electricity and Desalinates Water
With No Waste Brine
https://physicsworld.com>solar-device-generates-electr…
Article by Wang in Journal JOULE
[13] Electricity generation from wind – U.S. Energy
information… –EIA
[14] How much do wind turbines cost? – Windustry
https://www.windustry.org › how_much_do_wind_turb…
[15]. Wind Turbine Cost: Worth The Million-Dollar Price In
2021?
https://weatherguardwind.com › how-much-does-wind-tur…
[16]Underground vs. Overhead: Power Line Installation-
Cost …
https://www.power-grid.com › … › Outage Management
[17]. Operation and maintenance costs of wind generated
power
https://www.wind-energy-the-facts.org › operation-and-…
[18]. Wind Turbine Transportation | Oversize Wind Blade,
Tower …
https://oversize.io › regulations › wind-turbine-blade-to…
[19] Hydroelectric Energy ! National Geographic Society
https://www.nationalgeographic.org > encyclopedia > hyd…
[20] Facts about Hydropower Get the full picture – International
https://www.hydropower.org › iha › discover-facts-abo…
[21]. Hydroelectric Power – an overview | ScienceDirect Topics
https://www.sciencedirect.com › topics › engineering › hy…
[22} Expanded list of advantages of hydroelectric power from theTop World Conference on Sustainable Development conference, Johannesburg, South Africa (2002)
[23]. Hydroelectric Power Water Use – USGS
https://www.usgs.gov › water-science-school › science
[24] Nuclear Energy Institute – Home
https://nei.org › ..
[25] Uranium-235 | chemical isotope | Britannica
https://www.britannica.com › Science › Chemistry
[26] Nuclear Power Plant Construction Costs –
Synapse Energy …
https://www.synapse-energy.com › default › files
[27] NUCLEAR 101: How Does a Nuclear Reactor Work …
https://www.energy.gov › articles › nuclear-101-how-d…
[28] Nuclear power plants – US Energy
Information … – EIA
https://www.eia.gov › energyexplained › nuclear-power-p…
[29]. Breeder Reactors – an overview – ScienceDirect. Topics
Https://www.sciencedirect.com > topics > engineering>br…
[30] Understanding the advantages and disadvantages of
breeder …
Https://sxiebcestruck,com > Uncategorized
[31]. High-temperature gas reactor – Wikipedia
https://en.wikipedia.org › wiki › High-temperature_gas…..
Framatome HTGR
https://www.framatome.com › us_platform-3225 › fra…
Safety Features of High Temperature Gas Cooled Reactor
https://www.hindawi.com › journals › stni
[32]. High Temperature Gas Cooled Reactor Fuels and
Materials
https://www-pub.iaea.org › PDF › TECDOC_1645
[33]. Performance of HTGR biso-and triso-coated fertile particles …
https://www.osti.gov › servlets › purl
[34] Is Thorium the Fuel of the Future to Revitalize Nuclear …
https://www.power-eng.com › Nuclear › New Projects
–//–
The views and opinions expressed through the MAHB Website are those of the contributing authors and do not necessarily reflect an official position of the MAHB. The MAHB aims to share a range of perspectives and welcomes the discussions that they prompt.