
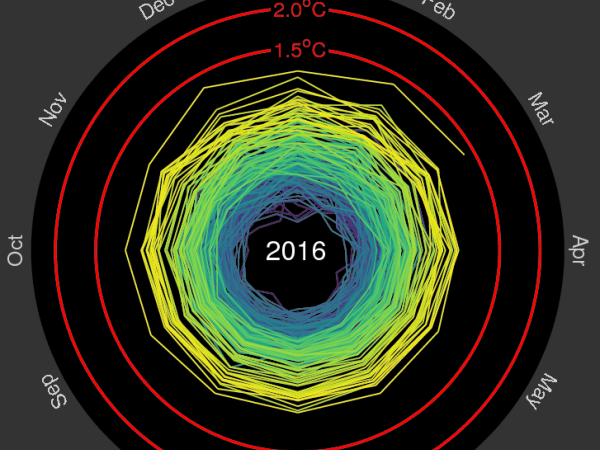
This recent animation from Ed Hawkins at he National Centre for Atmospheric Science at the University of Reading, is being used to bring attention to the dramatic increase in global temperature from 1850-2016. You can learn more about the animation and the data sources used here.
Spiralling global temperatures from 1850-2016 (full animation) https://t.co/YETC5HkmTr pic.twitter.com/Ypci717AHq
— Ed Hawkins (@ed_hawkins) May 9, 2016
Ed Hawkins is a climate scientist in the National Centre for Atmospheric Science at the University of Reading. He was a Contributing Author for the IPCC 5th Assessment Report and can often be found on twitter: @ed_hawkins
The views and opinions expressed through the MAHB Website are those of the contributing authors and do not necessarily reflect an official position of the MAHB. The MAHB aims to share a range of perspectives and welcomes the discussions that they prompt.