
Item Link: Access the Resource
Date of Publication: December 13
Year of Publication: 2022
Publication City: New York
Publisher: The New York Times
Author(s): Nadja Popovich, Mira Rojanasakul, Brad Plumer
Our interactive map reveals stark disparities in how different U.S. households contribute to climate change.
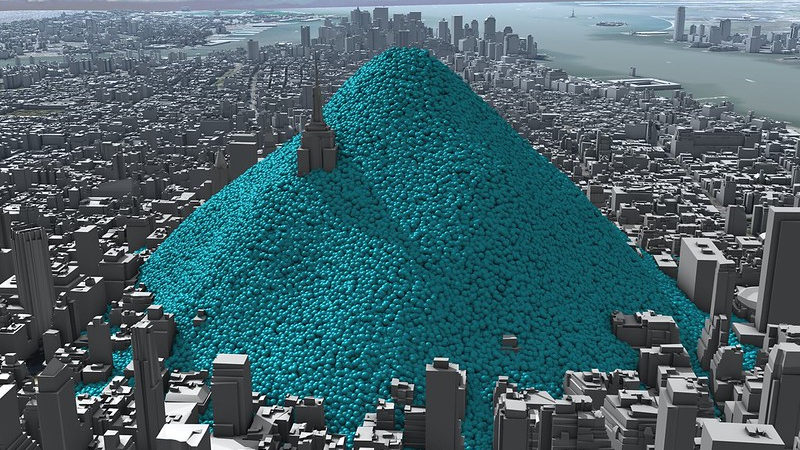
New data shared with The New York Times reveals stark disparities in how different U.S. households contribute to climate change. Looking at America’s cities, a pattern emerges.
Households in denser neighborhoods close to city centers tend to be responsible for fewer planet-warming greenhouse gases, on average, than households in the rest of the country. Residents in these areas typically drive less because jobs and stores are nearby and they can more easily walk, bike, or take public transit. And they’re more likely to live in smaller homes or apartments that require less energy to heat and cool.
Moving further from city centers, average emissions per household typically increase as homes get bigger and residents tend to drive longer distances.
But density isn’t the only thing that matters. Wealth does, too.
Higher-income households generate more greenhouse gases, on average, because wealthy Americans tend to buy more stuff — appliances, cars, furnishings, electronic gadgets — and travel more by car and plane, all of which come with related emissions. Take New York. America’s largest city provides the clearest example of these patterns:
Read the full article here.
The views and opinions expressed through the MAHB Website are those of the contributing authors and do not necessarily reflect an official position of the MAHB. The MAHB aims to share a range of perspectives and welcomes the discussions that they prompt.