Date of Publication: May 2019
Author(s): Gioietta Kuo
WHY WE SHOULD WORRY
Our world economy is based on the capitalist system which assumes forever a positive Gross Domestic Product – GDP. At the same time 196 governments in December 2017 have signed onto the Paris agreement limiting global temperature rise to less than 2 degrees C by 2100 from the pre-industrial age. IPCC even go as far as stating that the world would benefit with a 1.5 degree C by 2100 giving us a sustainable and equitable development. However already extreme weather is showing devastation in terms of hurricanes, flooding, drought etc … in many parts of the world. Despite all this, governments have not altered their policies in pursuing a higher and higher growth rate [1]. Just a few days ago, we have been told that real GDP in the US increased 3.2 % in the first quarter of 2019 according to the “advance” estimate released by the Bureau of Economic Analysis [2]. In the fourth quarter of 2018, real GDP increased 2.2 percent. Obviously we continue ‘business as usual’ and are not concerned about using up our resources!
Energy consumption worldwide grew by 2.3% in 2018, nearly twice the average rate of growth since 2010, driven by the observed robust economy [3]. More than 40% of the growth in 2017.
Electricity continues to assert itself as the “fuel” of the future, with global electricity demand growing by 4% in 2018 to more than 23,000 TWh. This rapid growth is pushing electricity towards a 20% share in total final consumption of energy. Increasing power generation was responsible for a little more than half of the growth in primary energy demand.
What are the consequences of the higher GDP that we are pursuing?
Yes, we are rapidly depleting our resources. Unfortunately most of the demand for energy falls on the use of fossil energy, oil, gas and coal. With Global energy demand increasing by 2.1% in 2017, as 72% was in fossil fuel [1] [3], 25% in renewables and remainder by nuclear. Naturally this results in a rise in CO2 emission – by 1.7 % in 2017, reaching a historic high of 33.1 gigatons.
LIMIT OF FOSSIL FUELS
In this article we want to point out categorically the fact that there is a LIMIT to the fossil fuels on earth that we are gobbling up. We are oblivious of the fact that there will be a time, measured in decades, when these fuels will run out. Because of global population rise, there is a growing demand for energy. This growth is endangering our future. What will we do when fossil fuels run out? What energy sources can we rely on after this happen?
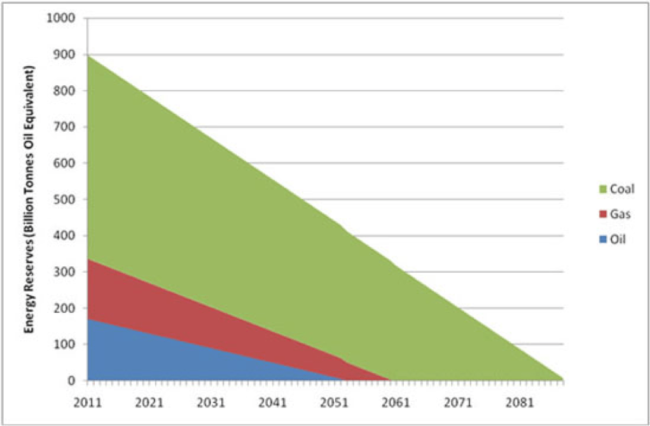
In figure 1 [4] we show the future energy reserves in billions of oil equivalent, Btoe, as a function of year. While we obliviously use up fossil fuels without taking stock of about what future reserves look like, we should take note of the endpoints shown here. These endpoints are dangerously close: Since our society is so dependent on fossil fuels, it therefore is extremely important for us to know when these fuels will run out according to [4]:
Oil will end by 2052 – 30 years time
Gas will end by 2060 – 40 years time
Coal will last till 2090 – 70 years time
However, according to BP [5], earth has 53 years of oil reserves left at current rate of consumption.
Figure 1 Energy reserves in billion tonnes of oil equivalent – Btoe [4]
According to the 2019 Annual Energy Outlook [6] global GDP growth between 2017 and 2040 is expected to average 3.4%. The world energy demand will grow by 1/3 through 2040, driven mostly by rising consumption in transportation in China, India and parts of Asia.
This is obviously unsustainable. These are horrific figures that will happen sooner than we can possibly mitigate.
OIL
Global oil demand grew by 1.3%. in 2018. Today oil supplies about 40% of the world’s energy and 96% of its transportation energy. It has consumed 875 billion barrels [7]. The world has been consuming an equivalent of over 11 billion tonnes per year [4]. Crude oil reserves are vanishing at a rate of more than 4 billion tonnes a year. Many oil wells have already peaked and new wells are becoming more difficult to find. Another 1,000 billion barrels of proved and probable reserves remain to be recovered.
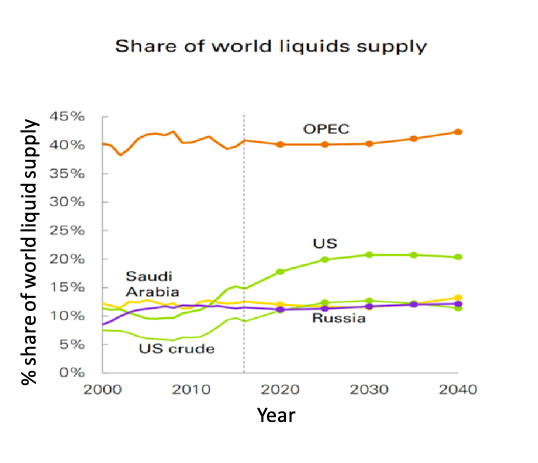
In Figure 2 we show the current dominance of OPEC which is controlled by most Middle Eastern countries. However over the next 3 years, it is projected that US production will cover 80% of the world’s demand growth. US will turn into ‘oil nation’ with record exports ‘eating’ into OPEC market share [8]
Figure 2 Percentage share of world liquid supply by year This week the IEA, International Energy Agency, released ‘Oil 2018’ [9] its 5 year market analysis and forecast. The report notes that “over the next 3 years, gains from the US alone will cover 80% of the world’s demand growth.” It projects a growth by another million barrels per day from 2017 levels by 2022. The base case projects growth of around 3 million barrels per day over the next 5 years. Overall projection is that global oil production capacity will grow by 6.4 millions by 2023.
BP has also revised its prediction which is similar. In its recently released 2018 Energy Outlook [10], it predicts that the U.S. will become “by far the largest producer of liquid fuels.”
Up to 2020, world oil consumption has been rising by about 60% because of growing transportation. China and India have the highest rate of growth. China at rate of 7.5% and India 5.5%.
However, there has been a ramp up of shale oil and gas extraction. Fracking [11] involves the extraction of shale gas by drilling into the the Earth and pumping boreholes with a high pressure water mixture. This is water and electricity intensive. It uses huge amounts of energy to get even more energy and also uses chemicals and metals which poison the groundwater and the environment. It is a growing technology which needs our critical estimation.
Fracking has been safely used in the United States since 1947. More than 1.7 million US wells have been completed using the fracking process, producing more than seven billion barrels of oil and 600 trillion cubic feet of natural gas.
NATURAL GAS
Gas totalled 23% of total energy demand, but grew at a 4.6% rate in 2018. Gas had the second highest share of total electricity generation at 23%, or 6,091 TWh. How much natural gas does the United States have, and how long will it last? [12]
What is the volume of world natural gas reserves? As of January 1, 2018, there were an estimated 7,124 trillion cubic feet (Tcf) of total world proved reserves of gross natural gas [13] From IEA. Last updated: March 8, 2019.
However, for the US, the U.S. Energy Information Administration estimates in the Annual Energy Outlook 2019 that as of January 1 2017 there were about 2,459 trillion cubic feet (Tcf) of technically recoverable resources (TRR) of dry natural gas in the United States.
Taking into consideration the current rate of natural gas production and current known natural gas reserves, we have about 52.8 years worth of natural gas reserves left. We will still have gas and coal left by the time oil runs out in 2052. But if we increase gas production to fill the energy gap left by oil, then those reserves will only give us an additional eight years, taking us to 2060. We should realize that burning gas impacts on global warming because of CO2 emission.
COAL
Global coal demand is up 0.7% in 2018 [15]. Coal’s share of total electricity generation totaled 10,116 TWh, up 2.6% from 2017, as it commanded 38% of total generation around the world.
Coal is the oldest fuel we have and it has taken few hundred millions of years to form from vegetation. The US, China and India are still actively mining coal. How long will coal last? It will depend on new technology, may be 150 years in order to replace oil and gas.
According to the IEA, in 2017 total global coal consumption in energy terms increased by 1 percent, or 50.4 megatons of coal equivalent (Mtce). Again, China and India lead the increase in consumption. Coal fired power generation continues to be the single largest emitter, accounting for 30% of all energy related CO2 emissions.
SOURCES OF NON-FOSSIL ENERGY
While the world is gobbling up fossil fuel, we are also developing alternative fuels.
Renewable energy – solar and wind
The world is actively developing renewable sources of energy – solar, wind and hydro – though the latter is limited because of global warming and overall lack of water. Already renewable energy contribute 1/4 of the world’s demand and is the highest growth rate of any energy source in 2017 [16]. Global renewable power production increased by 6.3% in 2017. China and EU contribute 50% of the the increase in renewable based electricity generation followed by US, India and Japan. The growth rate in 2017 is around 75 Million tonnes oil equivalent (Mtoe).
Nuclear energy
As fossil fuels begin to disappear, nuclear power is becoming more and more prominent because it is the only alternative base system capable of providing electricity continuously 24 hours a day. It is carbon-free, vital to our clean energy future. It was first developed in the 1950s and since then its safety features have been much improved. Now over 11% of the world’s electricity is produced from nuclear energy. Nuclear grew by 3.3% in 2018 mainly as a result of new capacity in China and the restart of 4 reactors in Japan [17].
Uranium may last over 150 years. But the coming of thorium-based nuclear reactors has been touted as the future of energy [18]. First, thorium is more abundant in nature than uranium. Thorium 232 can be used in conjunction with Uranium, to transmute to Uranium 233 to be used in various kinds of reactors. A variety pf reactors may be used, in particular molten salt reactors. Here we want to emphasize a new next generation high temperature gas cooled reactors (HTGR), which is safe, clean and sustainable. It is well suited for thorium-based fuels in the form of “TRISO” coated particles of thorium mixed with plutonium or enriched uranium coated with pyrolytic carbon and silicon carbide layers which retain fission gases. The fuel particles are embedded in a graphite matrix that is very stable at high temperatures. Such fuels can be irradiated for very long periods and thus deeply burn their original fissile charge. China is experimenting the so called ‘pebble bed’ design which is very stable and very safe.
A novel technology to be explored in view of that the world has only 60% of water it needs is the cogeneration of nuclear energy with desalination where the heat of the water cooling the reactor is used for high pressure desalination. The membrane used can be a nanotechnology graphene.
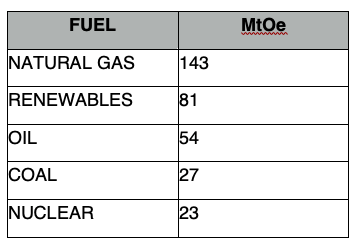
SUMMARY [3]
Table 1 Global primary energy demand – fuel share – in 2018 Mtoe
REFERENCES
[1] Extreme weather devastates, where is the action? Gioietta kuo. Oct 2018. Stanford MAHB
[2] Gross Domestic Product | U.S. Bureau of Economic Analysis (BEA)
[3] Global Energy & CO2 Status Report – iea.org
[4] When Will The Earth Actually Run Out Of Fossil Fuel?
[5] How long will world’s oil reserves last? 53 years, says BP
[6] World Energy Outlook – International Energy Agency (updated)
[8] U.S. Oil Producers Projected To Eat OPEC’s Lunch – forbes.com
[10] BP Energy Outlook | Energy economics | Home
[11] What is Fracking? | Shale Oil and Natural Gas – ipaa.org
[12] How Much Natural Gas Is Left In The World, & When Will We Run …
[13] What is the volume of world natural gas reserves? – FAQ – U.S …
[14] How much natural gas does the United States have, and how …
[15] Global coal demand up 0.7% in 2018, largely due to Asia: IEA
[16] Renewables supply 25% of global power in 2017 – IEA
[17] World Nuclear Power Reactors – World Nuclear Association
[18] Thorium – World Nuclear Association
The views and opinions expressed through the MAHB Website are those of the contributing authors and do not necessarily reflect an official position of the MAHB. The MAHB aims to share a range of perspectives and welcomes the discussions that they prompt.


