

As we all know, the world is producing more and more greenhouse gases (GHG), mainly carbon dioxide CO2, and methane CH4, which are released through human activities like deforestation and burning of fossil fuels, though natural processes such as respiration and volcanic eruptions also play a part. So far, land plants and the ocean take up 55% of the extra carbon we have put into the atmosphere while about 45% has stayed in the atmosphere. About 20% will stay in the atmosphere for thousands of years.
Recent Update on CO2 Emissions
Figure 1 shows direct measurements of atmospheric CO2 from 1975 to April 2018 in parts per million (ppm), or the number of carbon dioxide molecules per million molecules of dry air. For example, 1 molecule dry air to 0.000400 molecules of carbon dioxide is expressed as 400 ppm. The data are from the National Oceanic and Atmospheric Administration (NOAA) Mauna Loa Observatory on Hawaii. This shows a monotonic increase that is accelerating with time: In the early 1980s the average increase was 0.6 ± 0.1 ppm per year. The increase over the last 10 years has averaged 2.3 ± 0.6 ppm per year, while the average increase from 2015 to 2016 was 3.5 ± 0.1 ppm per year, the highest on record
Figure 1: Atmospheric CO2 from Mauna Loa observatory from 1975 to 2018 [1]
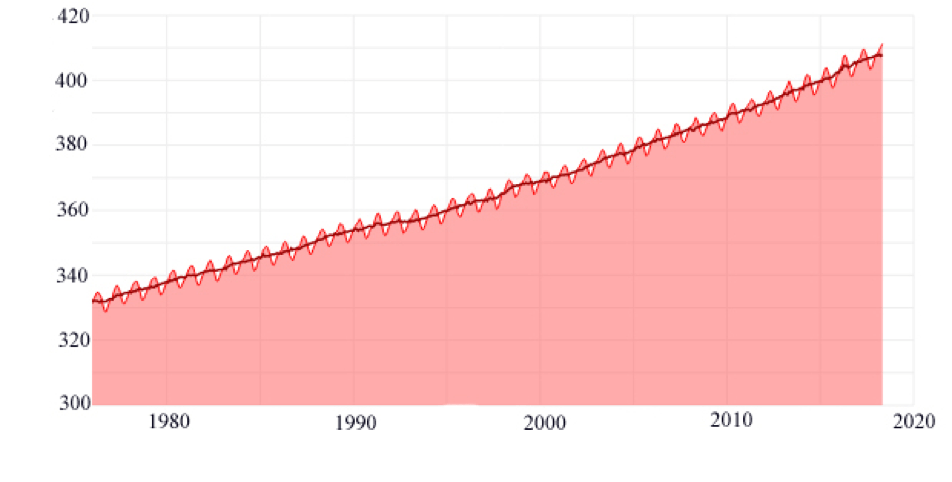
Figure 2: Expanded graph showing recent monthly mean atmospheric CO2 at Mauna Loa[2]
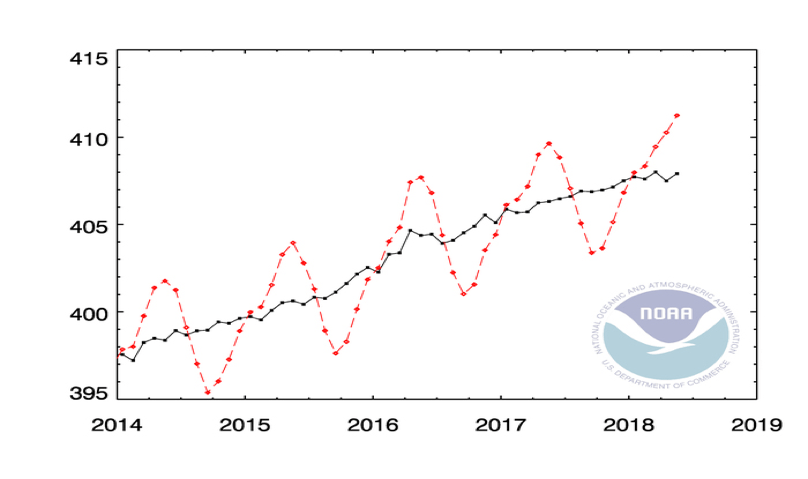
Figure 2 presents the data from 2014 through May 2018 on a finer time scale. The red shows seasonal variation while the black shows the average. The most recent figure is 411.25 ppm for May 2018.
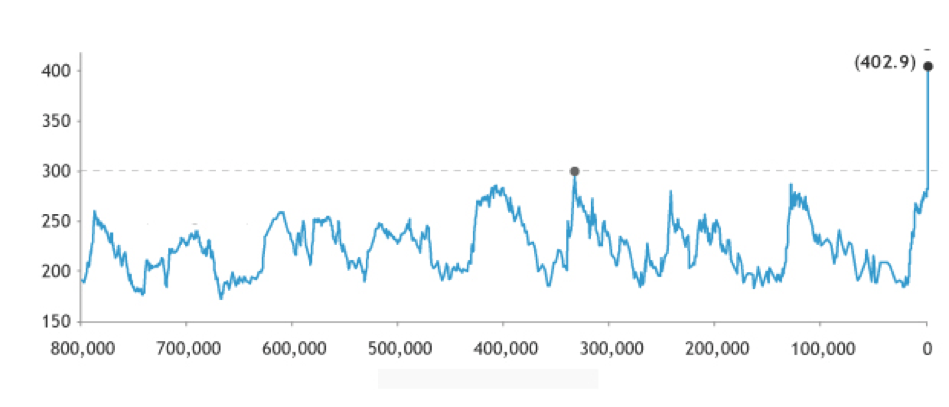
In figure 3 we show atmospheric CO2 data from the European Project for Ice Coring in Antarctica over a historic period dating from 800,000 years ago over several glacial periods. The peaks and valleys in carbon dioxide levels track the coming and going of ice ages (low carbon dioxide 200 ppm) and warmer interglacial periods (higher levels around 280 ppm). Throughout these cycles, atmospheric carbon dioxide was never higher than 300 ppm. We also show here a stark comparison with current data up to Oct 2016 which reached 402.9 ppm (black dot).
Figure 3: Atmospheric CO2 during ice ages and warming periods over the past 800,000 years, with data from Mauna Loa from 1975 to 2016[3]
In 2013, CO2 levels surpassed 400 ppm for the first time in recorded history. This recent relentless rise in CO2 shows a remarkably constant relationship with fossil-fuel burning, and can be well accounted for based on the simple premise that about 60 percent of fossil-fuel emissions stay in the air.
In fact, the last time the atmospheric CO2 amounts were this high was more than 3 million years ago, when temperatures were 2°–3°C (3.6°–5.4°F) higher than during the pre-industrial era, and sea level was 15–25 meters (50–80 feet) higher than today.
Analysis of the Carbon Footprint
The concept of carbon footprint is defined as the total amount of greenhouse gas (GHG) emitted through land clearance and production and consumption of energy, food, fuels, manufactured goods, materials, wood, toad, buildings, transportation and other services. The total emissions are expressed as CO2 equivalents, the amount of CO2 that would have the equivalent global warming impact, to facilitate comparison. By its very nature, we cannot provide a precise breakdown of the different components of the carbon footprint.
Most of the carbon footprint emission for the average person comes from ‘indirect’ sources, that is, fuel burned to produce goods far away from the final consumer. This is distinct from ‘direct’ emissions which come from burning fuel directly, such as in one’s car or home.
The main influences on carbon footprints include population, economic output, energy and carbon intensity of the economy. These factors are the main targets in order to reduce the footprint. For example, electricity is responsible for roughly 37% of CO2 emission. Refining coal production has greatly reduced the CO2 emission since 1980s and the amount of energy used to produce steel has decreased by 50% in recent years.
Direct CO2 Emissions
The Carbon Footprint of Energy
It is interesting to see what percentage of energy production come from. In particular, note the predominance of fossil fuels: coal, oil and natural gas. Compare this with the renewable and alternative energies.
Table 1: Emission Factors of Fuels[4], [5], [6]
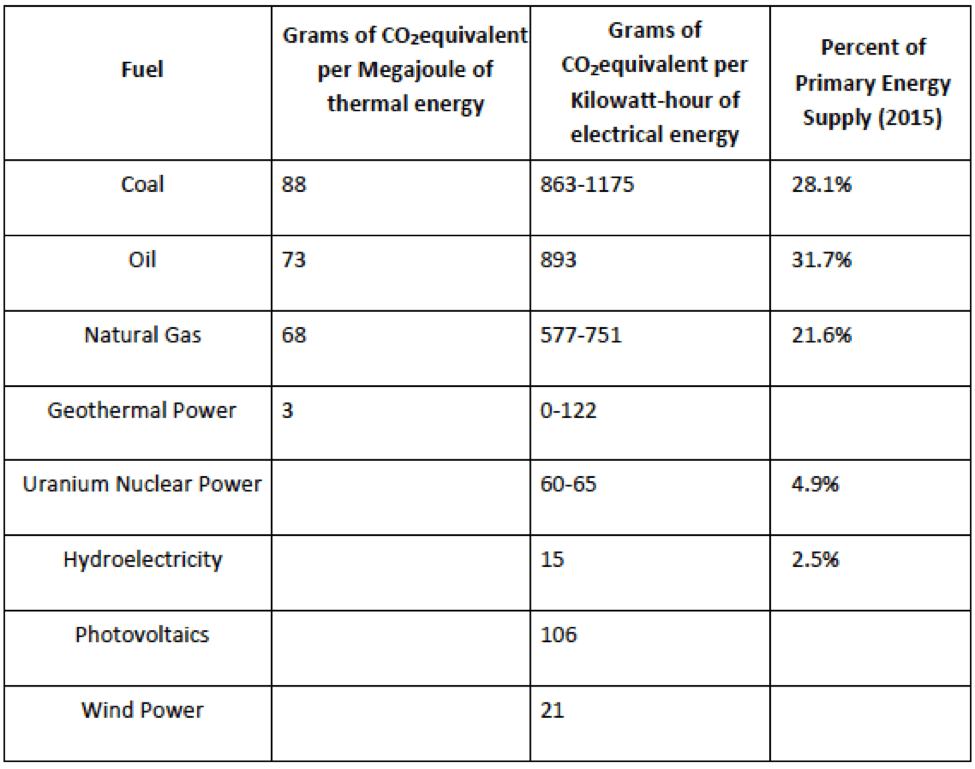
Generation of electricity currently account for half of the world’s man-made CO2 output because of the use of fossil fuel.This table shows that the world is currently still relying on fossil fuels for 82% of our energy production. As fossil fuels have much higher emission factors, they account for 92% of energy-based emissions of C02e. To reduce our carbon footprint, we should turn to alternative energies like solar, wind, hydropower and nuclear power. However, wind and solar and nuclear power do emit carbon during the construction phase. Although nuclear reactors are low cost in generation and produces much thermal power which can be used for desalination.
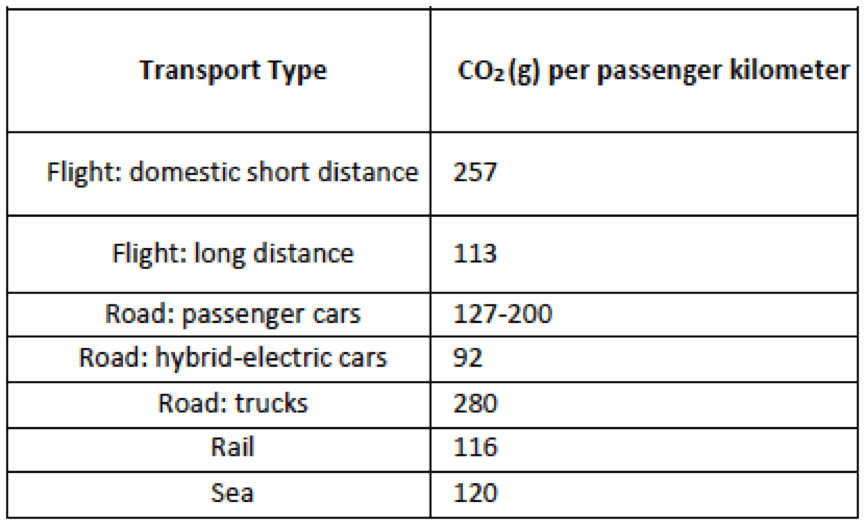
Personal Transport
Table 2: Approximate CO2 (g) per passenger kilometer by transport type[7], [8], [9], [10]
Indirect CO2 Emissions: The Carbon Footprint of Products
Figure 4: Figurative image of a carbon footprint. Not meant to be accurate
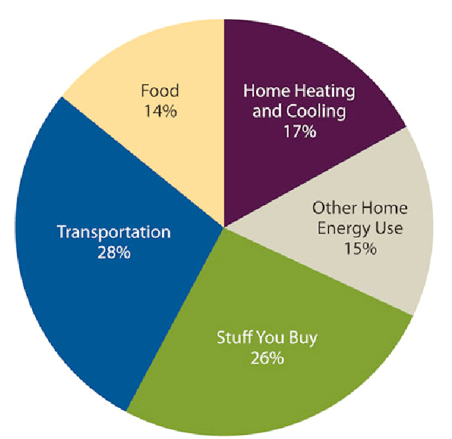
Figure 5: Pie chart showing where the average person’s carbon emissions come from[11]
We list here only a select few indirect contributors to a person’s carbon footprint:
Food
Table 3: Average dietary GHG emissions per day in kg of CO2 equivalent[12]

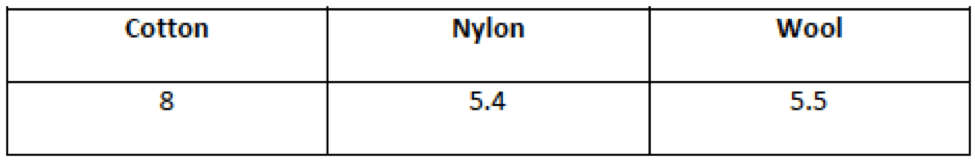
Textiles
Table 4: Typical CO2 equivalents per kilogram of textile at point of purchase[13]
Cement
Cement is the primary ingredient of concrete, which in turn forms the foundation and structures of our buildings. As such it constitutes 5% of global CO2 emissions. It is the second most consumed material after water. On average each year 3 tons of concrete are consumed by every person on the planet.[14]
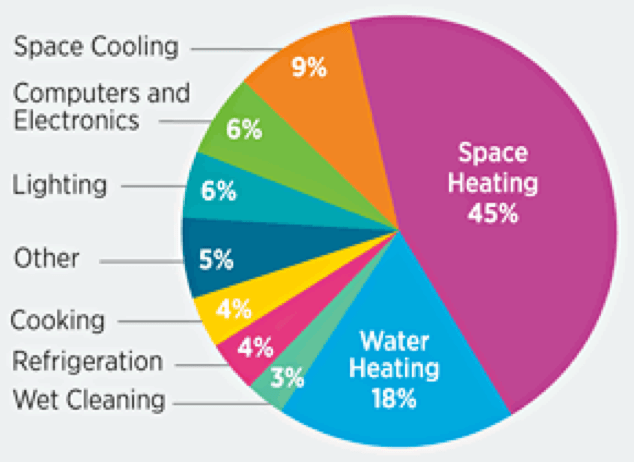
Figure 6: Pie Chart showing a summary of where a person’s carbon emissions come from inside a home[11]
How to Reduce Your Personal Carbon Footprint
1. Use non-fossil fuel energy for your utility.
2. Calculate the carbon footprint and find out the energy efficiency when buying products.
3. Minimize driving by carpooling, walking, biking, and using public transport.
4. Minimize purchases of new products, especially resource intensive, heavily packaged products.
5. Embrace a minimalist lifestyle.
6. Reduce energy use: e.g. seal heating and cooling ducts, add insulation, unplug unused electronics, hanging clothes out to dry, switch off unnecessary lighting at daytime, switch off lights when leaving home etc.
7. Buy locally sourced, organic, plant-based, unprocessed foods, farmers markets, green restaurants and health food stores. Minimize food waste by planning out meals ahead of time and freezing as much as possible.
8. Reduce water use: buy low flow shower and faucet heads, water efficient toilets/ washing machines/dishwashers, check for leaks, buy native drought-tolerant plants, etc.
9. Recycle as much as possible
10. Compost food waste.
11. Choose low energy intensive activities (e.g. hiking vs. sky diving, kayaking vs. power boats).
12. Use a manual lawnmower rather than motorized mower. Clear snow with shovel and not with motorized snow plough. Do not use a motorized blower to blow leaves.
13. Install solar panels on roof tops
14. Plant trees and local flowers in the garden.
15. Support climate action organizations. Research the companies you buy from (especially ongoing purchases). If they aren’t reducing greenhouse gases themselves and supporting action on climate change, switch to a company that is.
16. Learn more about climate change and share what you learn with others.
17. Encourage and support greenhouse-reducing practices in your community.
18. UN census reports that already the current world population stands at 7.63 billion and is projected to rise to 9.8 billion by 2050. Overpopulation is indeed the number one problem in the world today. Of course each additional person adds to the carbon footprint.[15]
Schemes to Reduce CO2 Emissions
The Kyoto Protocol defined legally binding targets and timetables for cutting the GHG emissions of industrialized countries that ratified the Kyoto Protocol. In December 2015, 195 countries signed an agreement to limit the world’s temperature rise below 1.5 degrees C above pre- industrial levels before the end of this century in the Paris Accord. But how many follow it as the global temperature shows no sign of abating? Trading with carbon offsetting certificate and carbon taxes are very useful ideas but politically it is tortuous to achieve.
Technologies to Pull CO2 Out of the Atmosphere
Many technologies have been suggested to pull CO2 out of the atmosphere such as Carbon Capture and Storage (CCS) but so far the cost in the billions has prevented it from realization. Very recently a Canadian company in Calgary (Carbon Engineering), in a venture supported by Bill Gates, has announced in the scientific journal JOULE that its prototype setup can pull CO2 out of the atmosphere and convert it into liquid gasoline, diesel or jet fuel at a cost of $94/ton when previous estimates were at $800/ton. However, what is the carbon footprint of building and running the plant on an industrial scale? The cost in any scheme in what is called geo-engineering tend to be in the billion $ range. Would it not be better and cheaper to re-forest or simply provide schemes to reduce deforestation?
Conclusion
Today, we stand on the threshold of a new geologic era. What is happening is human caused. This does not augur well for the future for if we were to continue fossil fuel use with business as usual such that humanity exhausts the reserves over the next few centuries, CO2 would inexorably continue to rise to levels on the order of 1500 ppm[16].
The atmosphere would then not return to pre-industrial levels for even tens of thousands of years into the future. Figure 3 not only conveys the scientific measurements, it shows a stunning difference between today and the past 800,000 years. It also underscores the fact that humans have a great capacity to change atmospheric CO2, and therefore the climate on our planet.
The planet Venus suffers from runaway greenhouse effect, which results in keeping its temperature at 400o C [17]. Its atmosphere is mostly carbon dioxide that comes from carbon cycling from molten rocks.
The condition of our Earth is ‘Anthropocene’, in other words is human made. Is it possible that we will end up like Venus one day in our reckless burning of fossil fuels?
Gioietta Kuo, MA at Cambridge, PhD in nuclear physics, Atlas Fellow at St Hilda’s College, Oxford and Princeton University plasma physics lab, is a research physicist. Over 70 professional articles and over 100 articles in environmental problems – in World Future Society-wfs.org, amcips.org, MAHB Stanford and other worldwide think tanks. Also in Chinese in ‘People’s Daily’ and ‘World Environment’—Magazine of the Chinese Ministry of Environmental Protection, and others in China. She can be reached at <kuopet@comcast.net.>
The MAHB Blog is a venture of the Millennium Alliance for Humanity and the Biosphere. Questions should be directed to joan@mahbonline.org
MAHB Blog: https://mahb.stanford.edu/blog/carbon-footprint/
[1] Data from Climate Change: Atmospheric Carbon Dioxide | NOAA Climate.gov Oct 17, 2017.
[2] Data from Mauna Loa – NOAA Earth System Research Laboratory
[3] Data from Climate Change: Atmospheric Carbon Dioxide | NOAA Climate.gov Oct 17, 2017
[4] Life-Cycle Energy Balance and Greenhouse Gas Emissions of Nuclear Energy in Australia
[5] The possible role and contribution of geothermal energy to the mitigation of climate change
[6] Key world energy statistics
[7] Climate Change and Aviation: Issues, challenges and solutions
[8] Light-Duty Automotive Technology, Carbon Dioxide Emissions, and Fuel Economy Trends: 1975 Through 2017
[9] Updated Comparison of Energy Use & CO2 Emissions From Different Transportation Modes
[10] Ferry Shipping Conference 2008
[11] 20 Ways to Reduce Your Carbon Footprint – Global Stewards
[12] Dietary greenhouse gas emissions of meat-eaters, fish-eaters, vegetarians and vegans in the UK
[13] How Bad Are Bananas?: The carbon footprint of everything
[14] http://blogs.ei.columbia.edu/2012/05/09/emissions-from-the-cement-industry/
[15] Current World Population – Worldometers; World population projected to reach 9.8 billion in 2050, and 11.2 billion in 2100
[16] Graphic: The relentless rise of carbon dioxide
[17] Mariners to Venus – JPL – NASA
The views and opinions expressed through the MAHB Website are those of the contributing authors and do not necessarily reflect an official position of the MAHB. The MAHB aims to share a range of perspectives and welcomes the discussions that they prompt.